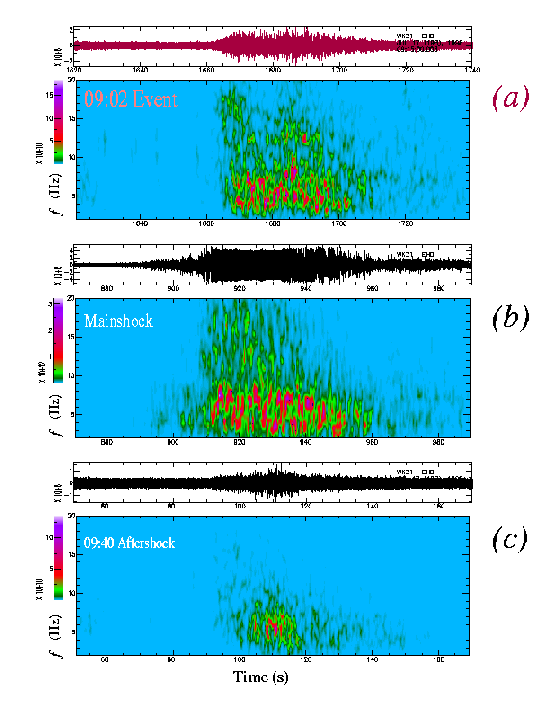
Time series and spectrograms of T waves received from the PNG sequence at the hydrophone station WK31 near Wake Island. All time series are 120-s long. The spectrograms contour the energy present in the signal as a function of time (abscissa) and frequency (ordinate). The 09:02 event (mb = 4.4) interpreted as the tsunami-generating slump is shown at the top (a), and compared to the mainshock (b) and an aftershock at 09:40 (c), with comparable magnitude (mb = 4.5) and location. Note the exceptional duration (45 s) of the 09:02 signal. The duration of the mainshock T wave is not affected by the obvious amplitude saturation of the signal.